Lead Sample
Here is a blog that consists our data about the Lead (Pb) Sample taken under the Scanning Electron Microscope (SEM). Dr. Hassel and Dr. McColgan provided us with 3 stages that each consisted of 6 different element samples in them. This is the data we collected when we studied the Lead Sample from these stages. Below is the data we collected:
Data Number: SAInTCentr
Magnification: 2300
Accelerating Voltage: 30000 Volt
Emission Current: 87000 nA
Working Distance: 15100 um
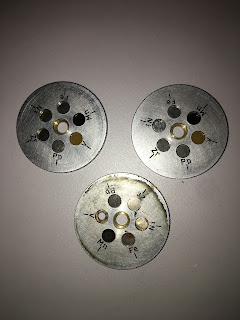
Above is a picture of the stages we used that consisted of the 6 different metal samples.
Here is a picture of our Research Team enjoying our time studying metal samples on the SEM. The picture is of Tristen Protzmann (left), Chamidu Warnakulasuriya (middle), and Brendan Waffle (right).
Above is the spectrum for our Lead Sample.
In the Lead Sample we found traces of Lead(Pb) and Chromium(Cr). The peaks we found were that Lead peaked at 0.278 keV, 1.835 keV, 2.335 keV, 9.179 keV, 10.544 keV, and 12.610 keV. As for the Chromium, it peaked at 0.523 keV and 5.409 keV.
Below is the data we collected using the HD Prime X-Ray Flourescence (XRF) Analyzer:


No comments:
Post a Comment